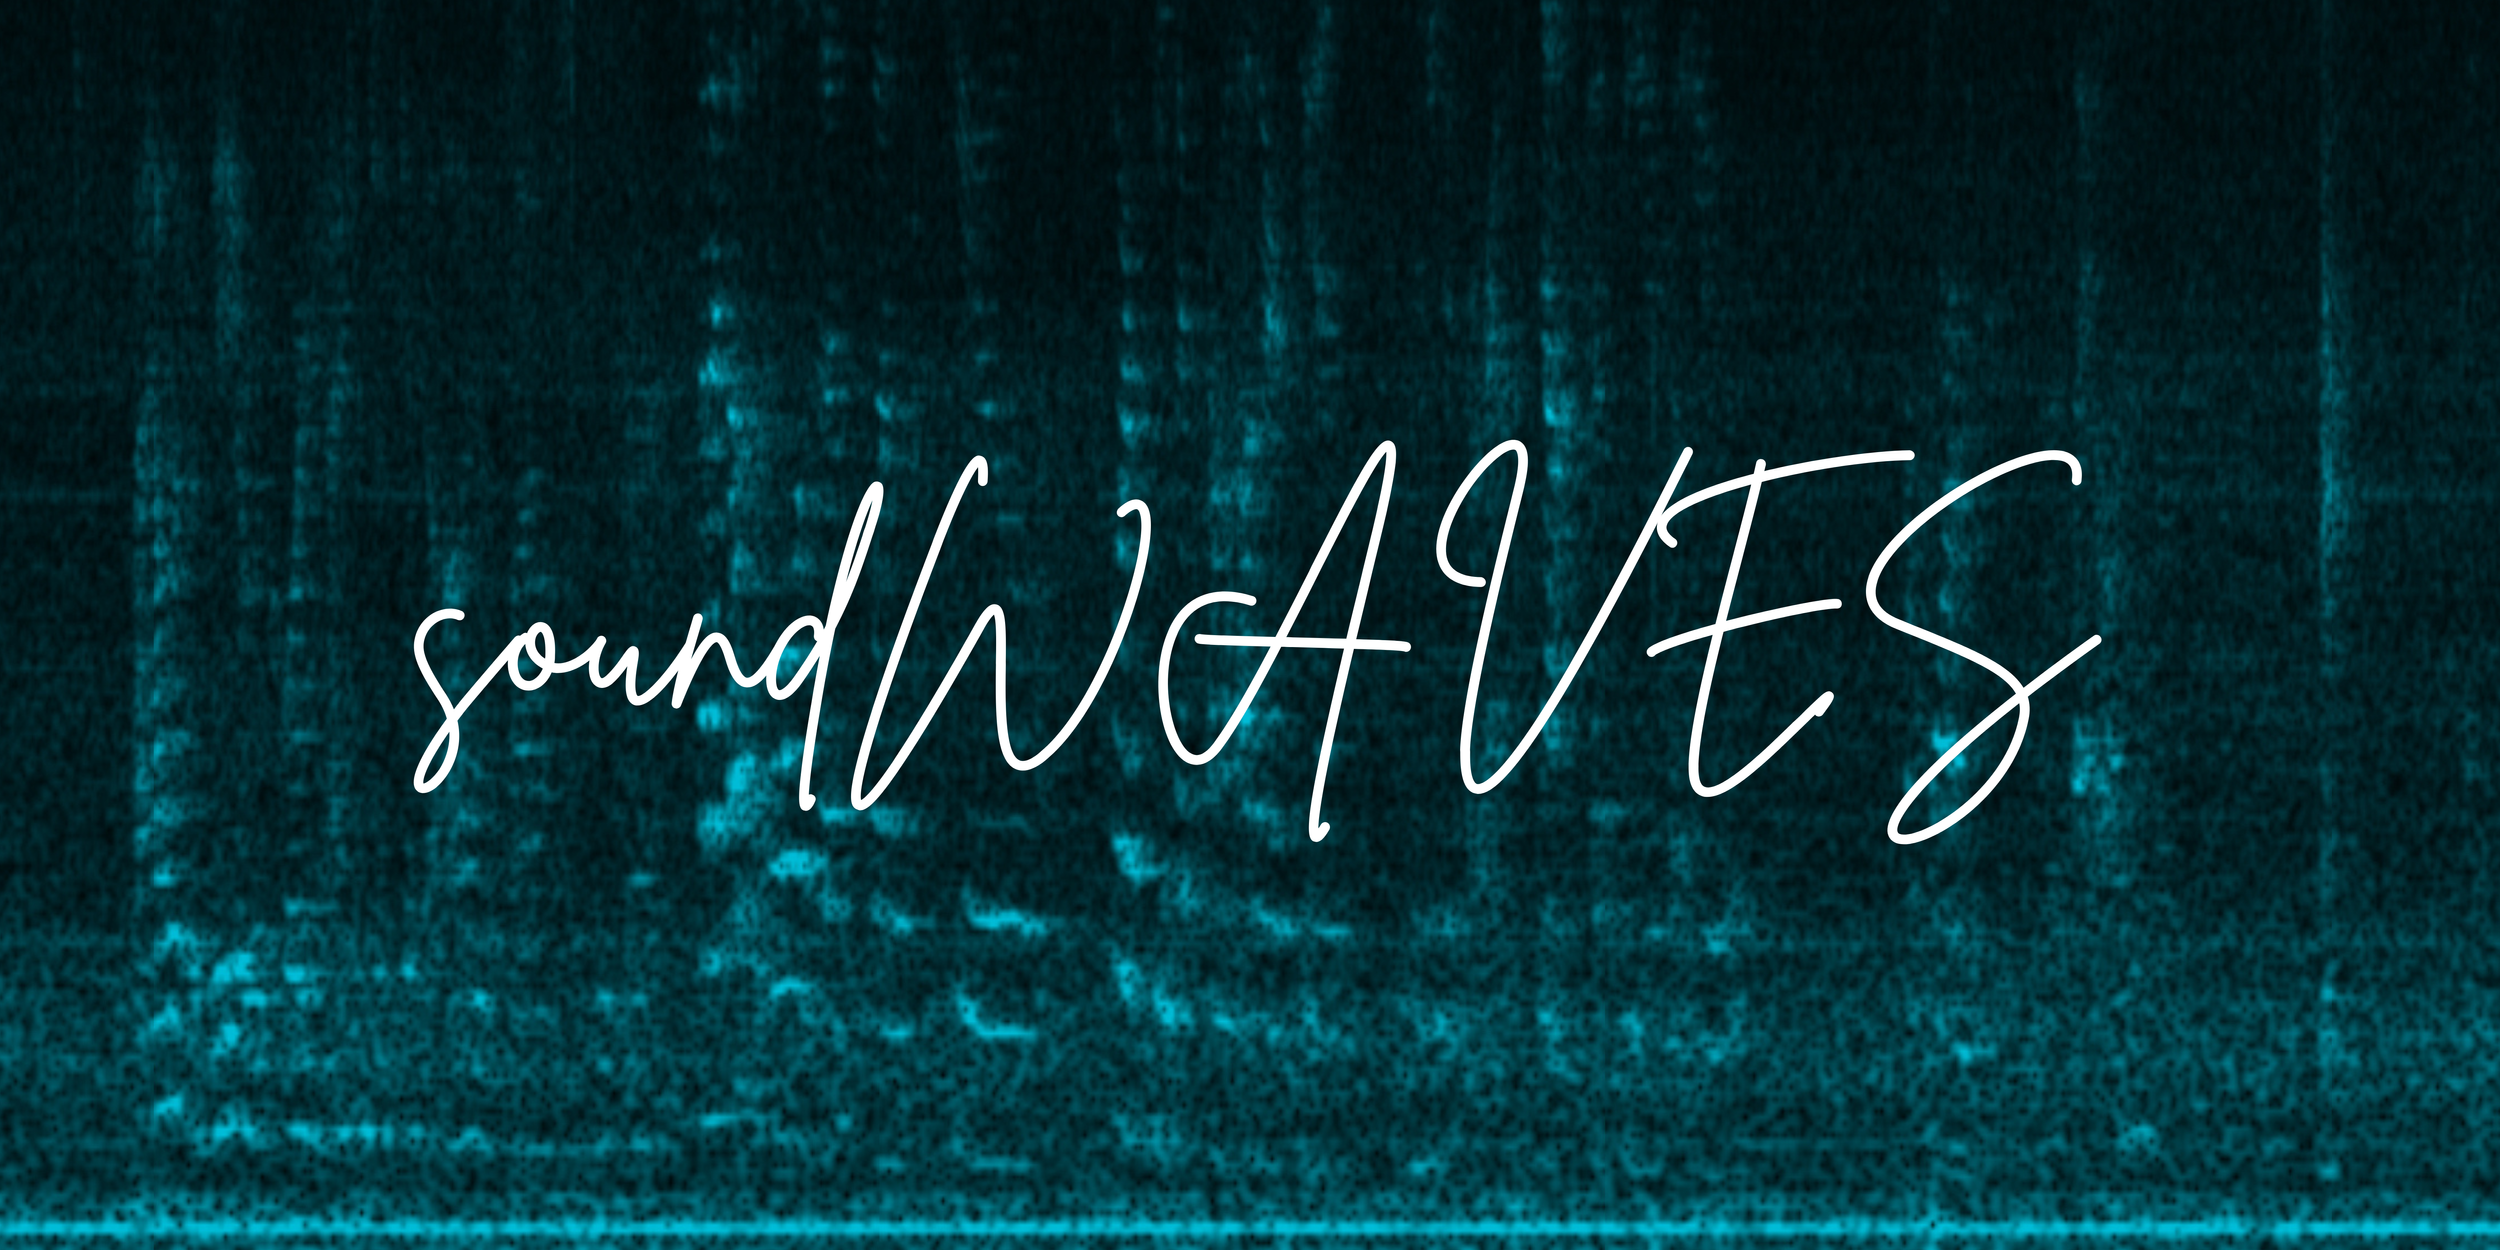
To understand the capacity of sound to change perception, the medium upon which one expresses oneself is paramount. “soundWAVES” is a collaborative multidisciplinary project between Madison Domanski, Megan Godshalk, and Abhinav Ranganathan, focused on visualizing sound in real-time. By focusing on the causal nature of improvisation alongside pre-composed music and visual aspects, the performance culminated in a multi-sensory experience for the audience members
THE ARTISTS
-

MADISON DOMANSKI
CHOREOGRAPHER/DANCER
-

MEGAN GODSHALK
VOCALIST
-

ABHINAV RANGANATHAN
COMPOSER/PRODUCER/GUITARIST
THE INFLUENCE OF SPECTROGRAMS
THE INFLUENCE OF SPECTROGRAMS
soundWAVES utilizes a spectrogram—a detailed, visual representation of sound over time—both as a source of inspiration and as its own form of creative media. By converting audio signals into visual patterns, a spectrogram provides key information about a sound's frequency (pitch) and amplitude (intensity) as it changes over time. The x-axis represents time, with sound progressing from left to right, and new audio data appearing on the right side of the projection. The y-axis displays frequency, where higher pitches are plotted closer to the top of the screen, and lower pitches are displayed near the bottom. Finally, the intensity of a sound is depicted through color or shading, with darker or brighter regions signifying louder frequencies compared to quieter ones.
Every sound is unique, containing its own blend of frequencies and amplitudes. The pitch information in the spectrogram is generated using Fourier analysis, a mathematical technique that breaks down complex sounds—or “signals”—into their individual sinusoidal components. Each sound consists of multiple frequencies, which, when combined, form the overall tone we hear. The fundamental frequency is the lowest and most intense frequency present, corresponding to the pitch perceived by human ears. All higher frequencies that appear in the spectrogram are called harmonics, which contribute to the texture and richness of the sound.
Spectrograms are invaluable tools in various fields. Sound engineers use them to fine-tune audio for clarity and balance. Audiologists rely on them to analyze hearing and sound perception. Speech-language pathologists use spectrograms to study speech patterns and diagnose disorders, while musicians can use them to refine their performances or compositions by visualizing and adjusting pitch and tone.
SOUND VISUALIZER
A laser sound visualizer is another fascinating way to transform sound into a visual experience. It works by shining a laser onto a small mirror attached to a flexible membrane, such as a balloon or plastic sheet. As sound waves hit the membrane, they cause it to vibrate, and these vibrations move the mirror. The laser beam, reflected off the vibrating mirror, projects dynamic patterns onto a wall or other surface.
Watch to learn more about this technology!
Our Sound Visualizer in Action
Hear from the Artist:
SOUND CREATION
Over the course of the project, the creative vision of the project shifted; Where we began by talking about “flow” and how good music and dance should flow from one movement to another, we later decided to focus on how to visualize this flow. Working with Megan proved to be very helpful in this sense, as her creative vision on how to include and layer both lead vocals and harmonies felt incredibly conducive to our shared vision. I built the rest of the music around her vocals, while trying to leave room for improvisation. In this vein, I intentionally left the bass, drums, and synth pads simple and repetitive in order to have the listener hear them while also being able to understand the back and forth improvisation between the three of us.
Hear from the artist about his process and listen to the final soundscore below:
“For this piece, I felt that the improvisation should be led by the vocalist- as such, most of my improvisation focused on a “call-and-response” technique, where I would attempt to complete phrases Megan sang on my guitar. In addition to this, the less is more approach to music became incredibly important in our improvisation as we were looking to have each note played or sung be reflected in the live spectrogram”
Performance Iterations
Night Rehearsal
Domanski’s First Choreography Sample
“My movement was a direct and instinctual reflection of what I was hearing. Performing set choreography driven by improv, I also allowed myself to be inspired by my collaborators on the spot as well. ”
— Madison Domanski
Creating a Multisensory, Deaf-Friendly Experience
Deaf and hard of hearing individuals experience sensory information in a different way than their typically-hearing peers. However, this does not mean that they cannot enjoy music. Many Deaf individuals enjoy music through vibrations. Bass frequencies, when loud enough, can be felt in the room. In order to enhance this experience, some individuals will hold on to a balloon to feel the vibrations more intensely. While these vibrations communicate rhythmic information, pitch information is mostly absent. However, with the use of the spectrogram and laser visualizer, a Deaf or hard of hearing audience member is receiving visual input which varies with pitch, intensity, and rhythm. Our dancer’s movement also communicates information about the
There have been exciting developments in this field. Recently, artists have experimented with wearing haptic vibrating vests to create a personalized sensory experience for Deaf concert goers and performers. It is our hope that our project inspires other musicians and sound artists to embrace multisensory experience as a way to engage members of the Deaf community.
Sign Language interpreter Neil Cordova, photographed by Dai Sugano of Bay Area News Group
FINAL PERFORMANCE
“There are so many ways that we can experience sound, all equally important and beautiful.”
— Megan Godshalk


